


Introduction: Why Your Conversion Rate Matters More Than You Think
Here’s a scenario I encounter constantly: A business owner looks at their website traffic and thinks, “We’re crushing it—thousands of visitors every month!” Then reality hits. They’re making barely any sales.
Sound familiar?
This is where the conversion rate formula becomes your secret weapon. It’s not just a mathematical equation; it’s the bridge between traffic and profit, the metric that separates thriving businesses from those stuck in the struggle zone.
Think of your website like a restaurant. You can have a packed parking lot, but if people aren’t sitting down to eat, you’re not making money. Your conversion rate tells you exactly how many of those “visitors” are actually becoming customers. And once you know that number, you can start fixing it.
In this guide, I’m breaking down everything you need to know about the conversion rate formula—from the basic calculation to advanced optimization strategies that’ll transform your business metrics from “meh” to impressive. Whether you’re running an e-commerce empire, managing a SaaS platform, or generating leads for your service, this guide has you covered.
What Is the Basic Conversion Rate Formula? (And Why It Actually Matters)
Let’s start with the fundamentals, because you can’t optimize what you don’t understand.
The conversion rate formula is elegantly simple:
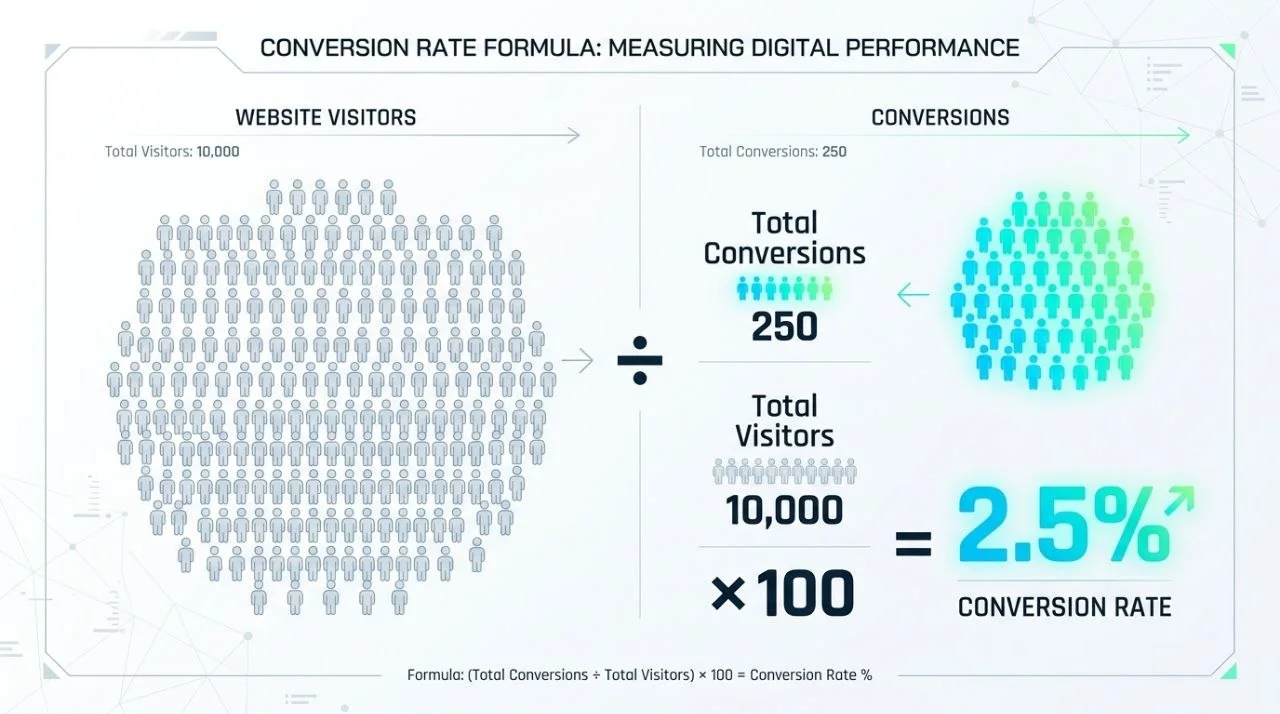
Conversion Rate (%) = (Total Conversions ÷ Total Visitors) × 100
That’s it. Seriously.
But here’s where most people get tripped up: What counts as a “conversion”? What’s a “visitor”? These definitions matter way more than people realize.
A conversion isn’t always a sale. It depends on your business goals. For e-commerce, yes, it’s a purchase. But for a SaaS company, it might be a free trial signup. For a consulting firm, it could be a demo request. For a newsletter, a single subscription counts. The beauty of the conversion rate calculation is its flexibility—you define success.
Visitors means unique users within a specific timeframe. Google Analytics tracks these automatically, but the devil’s in the details. Are you counting returning visitors separately? Session-based or user-based? These nuances shift your metrics dramatically.
Let me give you a practical example:
Your boutique fitness app has:
- 10,000 visitors in March
- 250 completed sign-ups
Using the formula: (250 ÷ 10,000) × 100 = 2.5% conversion rate
That’s your baseline. Now you can benchmark, analyze, and improve.
How Do You Calculate Conversion Rate for a Website?
The theory is clean. The practice? A bit messier. Let me walk you through the real process.
Step 1: Define Your Conversion Event
This is crucial. Are you tracking:
- E-commerce: Completed purchases?
- B2B SaaS: Free trial signups? Demo requests? Demo completions?
- Content sites: Email subscriptions? Account creation?
- Services: Consultation bookings? Form submissions?
Pro tip: You can track multiple conversion types. Set a primary conversion (your main goal) and secondary conversions (bonus actions). This layered approach reveals the full customer journey.
Step 2: Set Your Time Period
Conversion rates fluctuate seasonally. Measuring for just one day is noise. I recommend:
- Minimum: 2 weeks (catches weekly patterns)
- Standard: 1 month (smooths seasonal variations)
- Comprehensive: 3-6 months (reveals true performance)
Step 3: Gather Your Data
Use analytics platforms like Google Analytics 4 (GA4), Mixpanel, or Amplitude. These automatically count:
- Unique visitors
- Completed conversion events
- Segmented data (source, device, geography)
Step 4: Apply the Formula
Most platforms calculate this automatically, but understanding the math keeps you sharp.
Real-world scenario: Your e-commerce store tracked 45,000 sessions in Q1 with 1,125 purchases.
Conversion rate = (1,125 ÷ 45,000) × 100 = 2.5%
Not bad, but is it good? That depends on industry benchmarks.
What Is a Good Conversion Rate Benchmark by Industry?
Here’s the truth: There’s no universal “good” number. But there are industry standards.
| Industry | Average Conversion Rate | Range |
|---|---|---|
| E-commerce (General) | 2-3% | 1-5% |
| E-commerce (Luxury) | 1-2% | 0.5-2% |
| SaaS & Software | 3-5% | 2-10% |
| Lead Generation (B2B) | 5-10% | 3-15% |
| Email Marketing | 1-2% | 0.5-5% |
| Landing Pages | 5-15% | 3-25% |
| Affiliate Marketing | 1-2% | 0.5-3% |
Note: These are 2026 benchmarks from professional analytics platforms and industry reports.
But here’s the real insight: Benchmarks are starting lines, not finish lines. A 2% e-commerce conversion rate isn’t your ceiling—it’s your baseline for comparison.
Your actual “good” rate depends on:
- Your business model (high-touch B2B vs. direct-to-consumer)
- Your traffic quality (paid ads vs. organic search)
- Your product positioning (budget vs. premium)
- Your competitive landscape (crowded market vs. niche)
Does the Formula Differ for E-commerce vs. Lead Generation?
Great question. The core formula stays the same, but what you’re measuring changes.
E-commerce Conversion Rate
Focus: Completed purchases
Revenue-Generating Conversion Rate = (Total Purchases ÷ Total Visitors) × 100Example: Fashion retailer with 50,000 visitors and 1,200 orders = 2.4%
But here’s the secret: Track additional metrics too:
- Micro-conversions: Add to cart, newsletter signup, product review
- Customer value: Average order value, customer lifetime value
- Friction points: Cart abandonment rate, return rate
Lead Generation Conversion Rate
Focus: Qualified leads, not immediate sales
Lead Conversion Rate = (Qualified Leads ÷ Total Visitors) × 100Example: B2B marketing agency with 20,000 visitors and 400 qualified leads = 2%
But wait—many lead gen businesses track a secondary formula:
Sales Conversion Rate = (Sales Closed ÷ Leads Generated) × 100Example: 400 leads, 80 sales closed = 20% sales conversion rate
The big difference: Lead gen companies distinguish between visitor-to-lead and lead-to-customer conversions. E-commerce typically collapses this into one step.
The Hybrid Approach
Smart companies track both:
- Visitor → Lead conversion: Your website’s effectiveness
- Lead → Customer conversion: Your sales team’s effectiveness
This reveals whether your problem is marketing or sales—critical information.
How Do Sessions Factor Into the Conversion Rate Formula?
This trips up more people than you’d think.
In Google Analytics and most analytics platforms, a session is a group of user interactions within a given timeframe. Sessions reset after 30 minutes of inactivity (by default, though you can customize this).
Here’s the confusion: Visitors ≠ Sessions
One visitor might generate 5 sessions. One session might have 15 page views but no conversion.
Session-Based Calculation
Session Conversion Rate = (Conversions ÷ Total Sessions) × 100Example: 50,000 sessions, 1,250 conversions = 2.5%
User-Based Calculation
User Conversion Rate = (Users Who Converted ÷ Total Users) × 100Example: 30,000 unique users, 1,250 converted = 4.2%
Why the difference? Because some users visit multiple times before converting. If you use sessions, returning customers inflate your visitor count. If you use users, you get a cleaner picture of how many people, not how many visits, led to conversions.
My recommendation:
- For quick wins and optimization: Use sessions (more granular, daily-actionable data)
- For strategic planning: Use users (cleaner, long-term picture)
- For comprehensive analysis: Track both (they tell different stories)
Why Is Your Conversion Rate Low Despite High Traffic?
You’ve got traffic. Loads of it. But those visitors aren’t converting.
This is the most common pain point I see.
Here are the usual suspects:
1. Traffic Quality Issues
Your traffic source might be misaligned with your offer.
- Buying cheap clicks from poor-quality ad networks
- Ranking for keywords that don’t match your offer
- Attracting bargain hunters when you sell premium products
Fix: Audit your traffic sources. Compare conversion rates by source. Double down on the winners.
2. Unclear Value Proposition
Visitors don’t understand why they should convert.
- Your homepage messaging is confusing
- You’re not addressing visitor pain points
- Your unique selling point is buried or missing
Fix: A/B test your headline. Run surveys. Ask: “Why didn’t you convert?” (Use tools like Hotjar for this.)
3. Friction in the Conversion Path
Every step toward conversion is a cliff where people jump off.
- Sign-up forms asking for too much information
- Slow loading times
- Unclear call-to-action buttons
- Mobile experience is terrible
Fix: Simplify your funnel. A/B test form length. Optimize for mobile ruthlessly.
4. Targeting Wrong Visitors
You’re attracting quantity over quality.
- Your ads are too broad
- Organic traffic includes accidental visitors
- No audience segmentation
Fix: Refine your targeting. Be specific. Better 1,000 qualified visitors than 10,000 random ones.
5. Pricing or Offer Issues
Sometimes it’s not your website—it’s your offer.
- Price is too high for your positioning
- Offer doesn’t match market expectations
- Competitors are stronger
Fix: Research competitor pricing. Survey your audience. Test price points.
Can Conversion Rate Be Applied to Email Marketing?
Absolutely, and it’s one of the most underutilized insights.
Email conversion rate measures how many email recipients complete a desired action (click, purchase, signup).
The Email Conversion Rate Formula
Email Conversion Rate = (Conversions from Email ÷ Emails Delivered) × 100Example: Sent 50,000 emails, 500 people made a purchase = 1% conversion rate
But here’s where it gets interesting: Email conversion rates outperform most other channels.
| Channel | Average Conversion Rate |
|---|---|
| 1.5-4% | |
| Paid Search | 1-3% |
| Organic Search | 2-4% |
| Social Media | 0.5-1.5% |
| Display Ads | 0.1-0.5% |
Email dominates because you’re reaching engaged people who opted in to hear from you.
Advanced Email Metrics
Track these for a fuller picture:
- Click-through rate (CTR): (Clicks ÷ Emails Delivered) × 100
- Click-to-conversion rate: (Conversions ÷ Clicks) × 100
- Revenue per email: Total revenue ÷ Emails sent
Smart tactic: Segment your email list by engagement level and conversion history. High-engagement subscribers convert 3-5x better. Focus your premium offers there.
What Tools Help Track Conversion Rates Accurately?
You can’t improve what you don’t measure.
Analytics & Conversion Tracking
Google Analytics 4 (GA4)
- Free, industry-standard
- Tracks conversions with custom events
- Attribution modeling for multi-touch journeys
- Perfect starter tool
Hotjar
- Heatmaps showing where users click
- Session recordings revealing behavior
- Surveys asking why users don’t convert
- Visual insights that charts miss
VWO (Visual Website Optimizer)
- A/B testing built-in
- Heatmaps and session replays
- Statistical significance calculations
- Great for rapid optimization
Crazy Egg
- Similar to Hotjar, excellent visual tools
- Quick setup
- Good for small teams
Advanced Personalization & Testing
Google Optimize (increasingly integrated into GA4)
- Free A/B testing
- Personalization options
- Built-in statistical calculator
Omniconvert
- Full CRO suite with A/B testing
- Popup and survey tools
- Audience segmentation
- Excellent for e-commerce
Unbounce
- AI-powered landing pages
- Smart Traffic (AI routing visitors to best variants)
- Built-in conversion tracking
- Purpose-built for conversion focus
Optimizely
- Enterprise-grade experimentation
- Complex multivariate testing
- Advanced personalization
- For sophisticated teams
Specialized Solutions
Contentsquare
- Digital experience analytics
- Session replay technology
- Friction scoring
- Identifies exactly where users drop off
ABTasty
- Statistical rigor in A/B testing
- Progressive web app testing
- Good for technical teams
- Strong API for custom integrations
CXL Institute (not just a tool, but educational)
- Free CRO resources
- Experimentation platform
- Community and training
- Excellent for learning the craft
How Does Mobile Traffic Affect Conversion Rate Calculations?
Mobile has become non-negotiable. But here’s what many miss: Mobile conversion rates differ drastically from desktop.
The Reality
| Device Type | Typical Conversion Rate |
|---|---|
| Desktop | 2-3% (higher intent, fewer distractions) |
| Mobile | 1-1.5% (lower friction, higher abandonment) |
| Tablet | 1.5-2.5% (middle ground) |
Mobile users are often on-the-go, have smaller screens, and abandon forms faster. A clunky mobile experience tanks your overall conversion rate.
Key Mobile Optimization Tactics
- Simplify mobile forms
- Ask for essentials only
- Use single-column layouts
- Implement autofill where possible
- Optimize for thumb reach
- Buttons should be 48px × 48px minimum
- CTAs placed in bottom half of screen
- Don’t hide critical elements at the top
- Fast loading is non-negotiable
- Under 3 seconds loads convert 3x better
- Compress images aggressively
- Lazy-load below-the-fold content
- Test everything on mobile
- Your desktop A/B test might fail on mobile
- Conversion paths differ by device
- Mobile checkout should be streamlined
Track Device-Specific Metrics
In GA4, segment your conversion rate by device:
- Mobile conversion rate
- Desktop conversion rate
- Tablet conversion rate
Then optimize separately. What works for desktop might sabotage mobile.
What’s the Difference Between Micro and Macro Conversions in the Formula?
This distinction separates amateur from professional conversion optimization.
Macro Conversions (Primary Goals)
The big wins. These directly impact revenue.
E-commerce: Completed purchase SaaS: Paid subscription activation B2B Services: Closed deal Lead gen: Qualified sales-ready lead
These are your primary metrics. They define business success.
Micro Conversions (Leading Indicators)
Smaller actions that predict macro conversions.
E-commerce: Add to cart, wishlist save, product review SaaS: Free trial signup, feature upgrade, documentation visit B2B Services: Whitepaper download, demo attendance, pricing page visit Lead gen: Newsletter signup, form submission, chat initiation
Micro conversions matter because they’re earlier signals. Someone who downloads your guide is 3-5x more likely to become a customer than someone who does nothing.
The Smart Tracking Approach
Don’t choose between them. Track both:
Macro Conversion Rate = (Purchases ÷ Visitors) × 100 = 2%
Micro Conversion Rate = (Add-to-Carts ÷ Visitors) × 100 = 12%
Notice the gap? 12% of visitors engage, but only 2% buy. That’s your optimization playground.
What this tells you:
- You’re good at generating interest (12% engagement)
- You’re struggling with closing (only 2% buy)
- Focus on checkout friction, pricing, or trust signals
Putting It All Together: Your Optimization Strategy
Knowing the formula means nothing without action.
Here’s your playbook:
Week 1: Establish Your Baseline
- Define your primary conversion
- Set up proper tracking in GA4 or similar
- Calculate your current conversion rate for your main traffic source
- Document industry benchmarks for comparison
Week 2-3: Diagnose the Problem
- Segment your traffic by source, device, page
- Use Hotjar/Crazy Egg to watch real users
- Identify where people drop off
- Ask users why they didn’t convert (surveys)
Week 4+: Test & Optimize
- Start with highest-impact changes
- Run A/B tests with proper calculations (90%+ confidence threshold)
- Implement winning variations
- Measure impact on conversion rate
The Metrics That Matter Most
Track these weekly:
- Primary conversion rate
- Traffic volume (don’t sacrifice quality for quantity)
- Average order value / customer lifetime value
- Cost per conversion
- Conversion rate by traffic source
Final Thoughts: Your Conversion Rate Is a Living Thing
The conversion rate formula is simple. The application is infinite.
Every website, every funnel, every audience is different. Your 1% conversion rate might be crushing it for your market, or it might be leaving money on the table. You won’t know until you measure, analyze, and test.
The most successful businesses I’ve worked with aren’t the ones with perfect conversion rates—they’re the ones obsessed with improving their metrics. They track, test, learn, and iterate.
Start this week:
- Calculate your current conversion rate
- Compare it to industry benchmarks
- Identify your top friction point
- Run one A/B test to fix it
- Measure the impact
Small improvements add up. A 1% improvement in conversion rate on 10,000 monthly visitors means 100 additional conversions per month. Over a year, that’s 1,200 extra customers.
What are you waiting for?
Tools & Resources to Get Started
- GA4 Conversion Setup Guide: Google Analytics Help Center
- Hotjar Free Plan: Start with heatmaps and recordings
- Unbounce Free Trial: Build conversion-focused landing pages
- Omniconvert Free Resources: CRO best practices and templates
- VWO Knowledge Base: A/B testing methodologies